
Spec Sheet
Client
Liberty Mutual
Industry
Insurance
My Role
UX/UI Designer: Research, Facilitation, Experience Design, Design System, Prototyping
Team
UX Lead, Product Manager, Data Scientists, Engineers, Business Stakeholders, Insurance Brokers
Delivarables
Discovery Research, Co-Creation Workshops, Personas, User Flows, High-Fidelity Prototypes, Design System Contributions, Usability Testing
Tools
Figma, Maze, Hotjar, Qualtrics
Project Timeline
12 months
Year
2023–2024
Overview
Liberty Mutual, one of the largest insurance companies in Brazil, had spent more than a year developing a predictive recommendation engine designed to identify cross-sell and upsell opportunities for insurance brokers.
The technology was promising: by analyzing customer portfolios, purchasing behavior, and policy data, the platform could recommend the next best business opportunity for each client.
The challenge was that the algorithm existed in isolation — no UX involvement, no user validation, no structured way for brokers to interact with the insights being generated. When I joined, the team wasn't struggling with prediction accuracy. They were struggling with adoption.
Problem Statement
Insurance brokers manage large portfolios under constant pressure. The predictive engine had potential, but its early interface created friction rather than confidence.
Structural challenges included: no user research or validation, inconsistent visual language, weak information hierarchy, limited transparency around prediction logic, no structured broker feedback loop, and lack of integration with Liberty's broader digital ecosystem.
The core challenge: design an experience that helped brokers understand why an opportunity mattered and what to do next.
Process
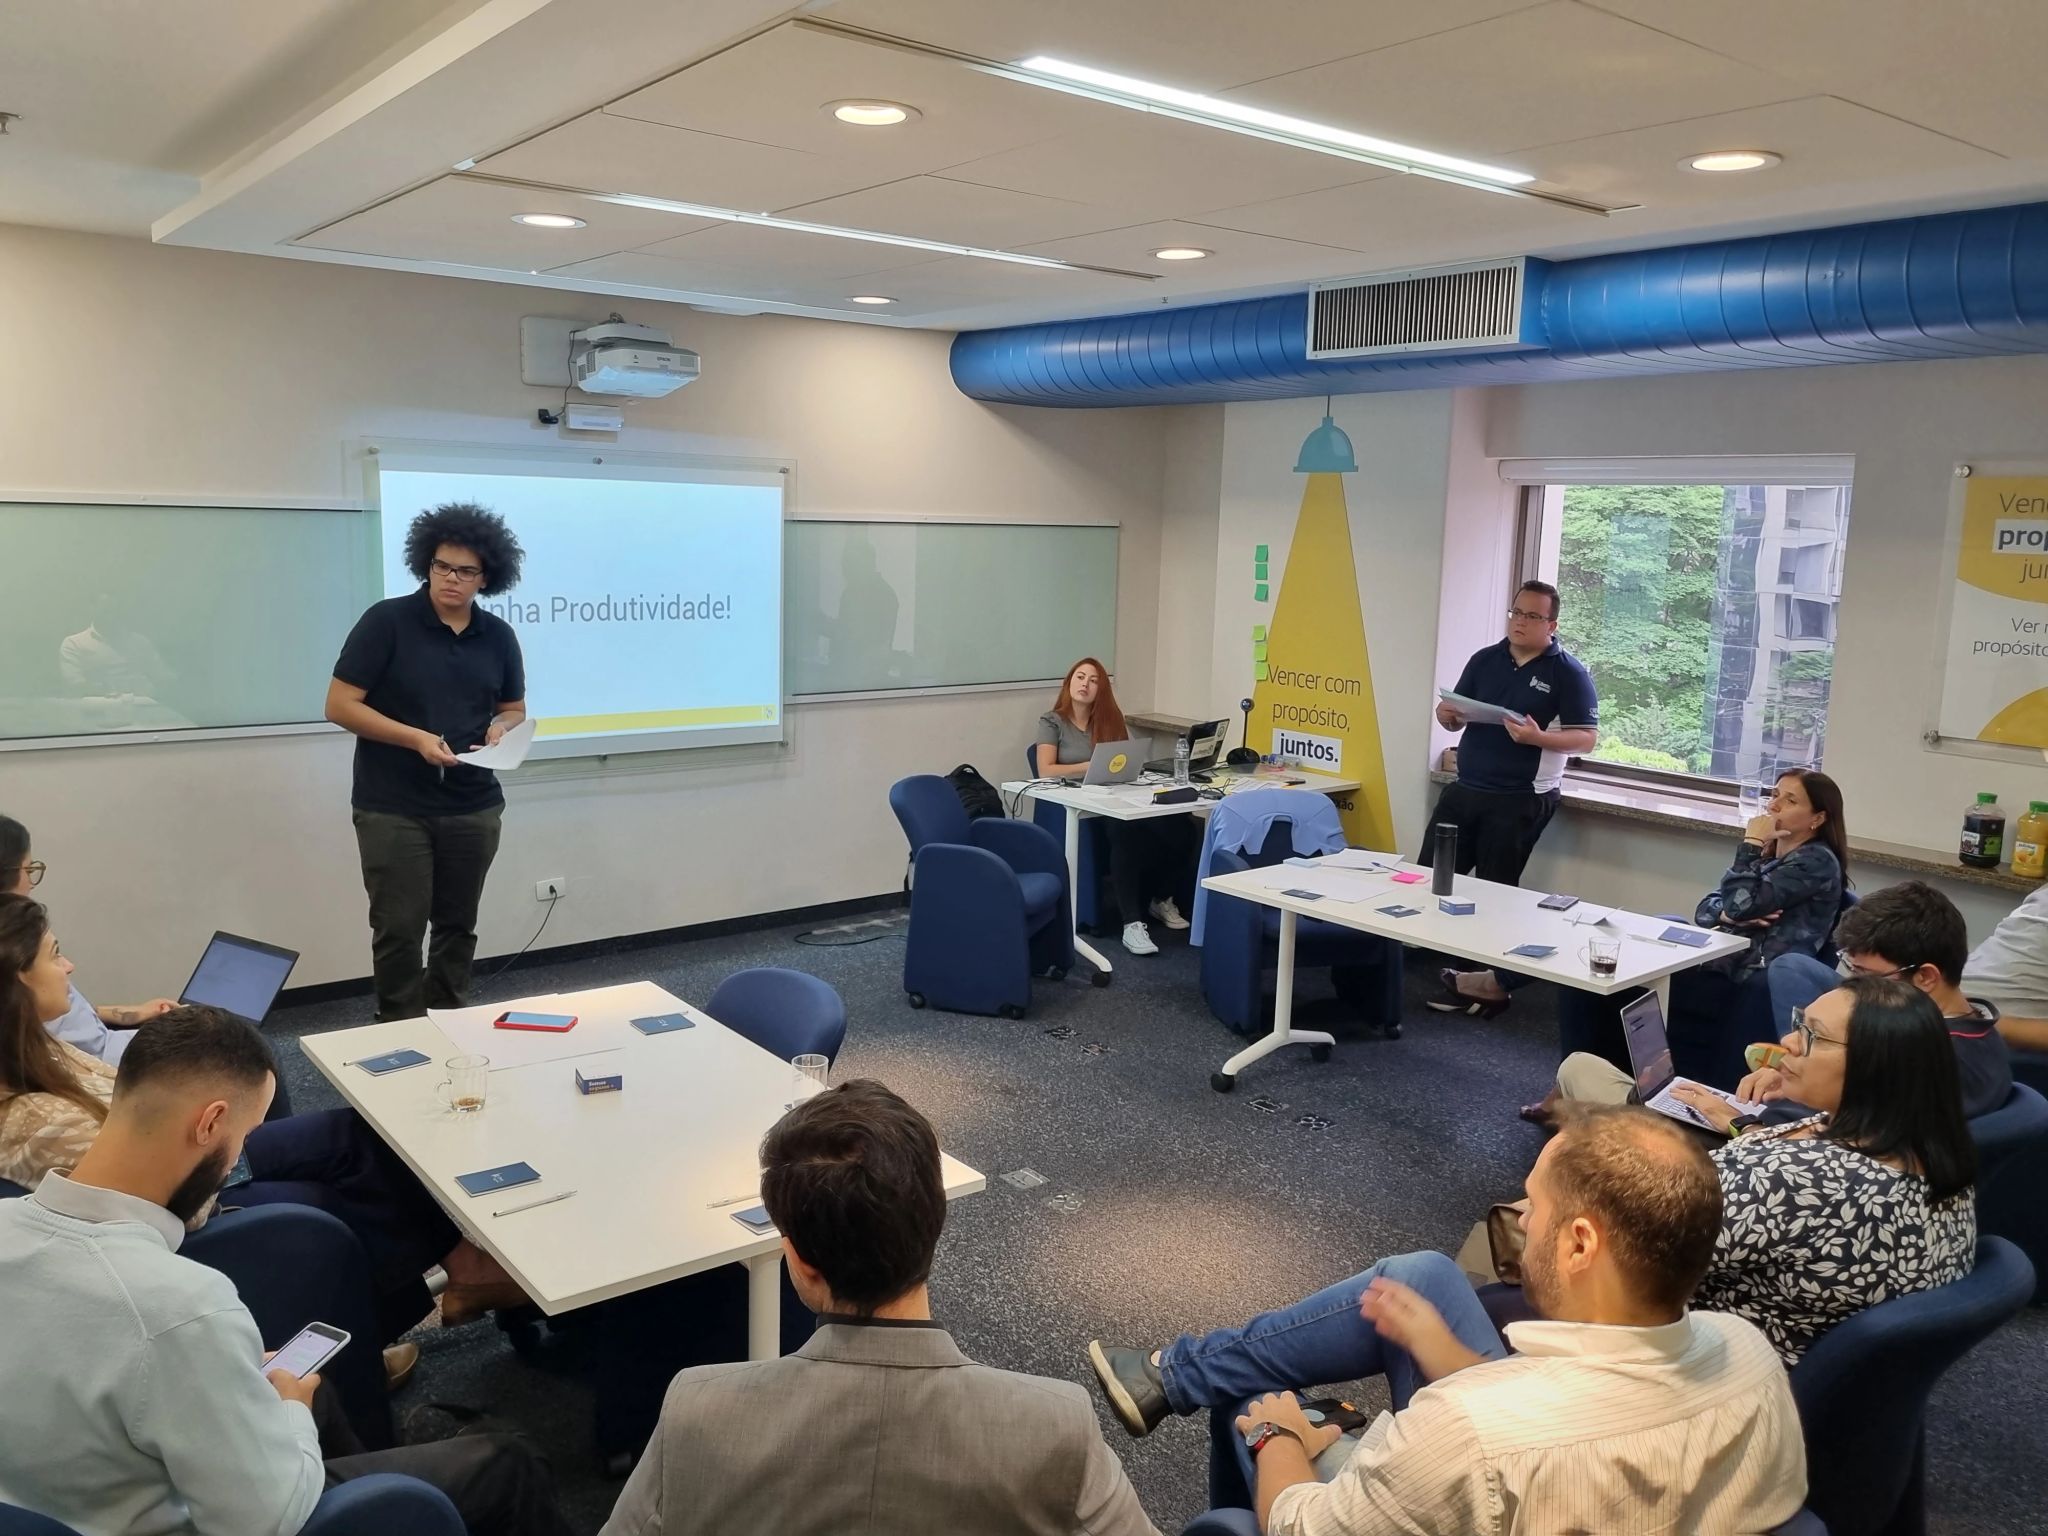
The project began with a comprehensive discovery phase. I conducted a heuristic evaluation identifying usability issues, navigation bottlenecks, inconsistent terminology, and prioritization gaps. We organized co-creation workshops with Liberty partner brokers to observe how they managed portfolios and made decisions under real-world conditions. Research methods: co-creation workshops, focus groups, high-fidelity prototype testing in Figma, Maze flow validation, Hotjar behavioral analysis, monthly Qualtrics surveys, NPS and User Effort Score tracking.


Key Decisions
Brokers weren't looking for more information, they were looking for clarity. Many existing insurance tools overwhelm users with reports and metrics. This led to a critical product decision: recommendations should function as prioritized opportunities rather than static analytical reports. Designing for action, not data consumption.
Insurance broker profiles across independent and branch segments. Research revealed brokers needed a faster way to identify where to focus each day — prioritized, filtered, and immediately actionable. The product credibility depended on the recommendation being understandable and relevant, not just accurate.

User Journey

Site Map

The redesigned dashboard surfaced the most relevant opportunities first, reducing time to identify potential cross-sell and upsell actions. Advanced filtering allowed brokers to segment opportunities by client profile, insurance products, and business priority. Prediction results were presented through clear visual patterns, making complex data understandable at a glance.
Analytics
Data informed every design decision. I used Maze to validate early prototypes with real users, combining interaction data with observed user reactions.
After launch, Hotjar provided heatmaps, click tracking, and session recordings to identify usability issues, while Firebase Crashlytics monitored production stability, helping us detect broken components and prioritize fixes based on real-world usage.
Finally, Qualtrics was integrated into our quarterly feedback loop to measure Net Promoter Score (NPS) and overall broker satisfaction, giving us a continuous pulse on customer sentiment and helping prioritize future product improvements based on both behavioral and attitudinal data.


Outcomes & Results
• More than 60 broker companies onboarded.
• Over 80,000 customers impacted within six months.
• R$ 2M+ in cross-sell and upsell revenue generated.
• Continuous quarterly feedback cycles established.
• Broker satisfactionvia NPS increased from 82% to 90% within three months.
• Design components adopted into Liberty's corporate design system.
Lessons Learned
• The biggest takeaway: predictive products live or die on trust.
• Brokers didn't need to understand every detail of the ML model behind the scenes, they just needed to believe that the recommendation in front of them was relevant, easy to grasp, and worth acting on.