
Spec Sheet
Client
MRV
Industry
Real Estate · Housing
My Role
UX/UI Designer: Facilitation, Usability Test, Experience Design, Design System, Prototyping
Team
UX Lead · UI Designer · Frontend Developers · Marketing Manager · Business Stakeholders
Delivarables
Design Thinking Workshops · User Journeys · Wireframes · High-Fidelity Prototypes · Usability Testing · Landing Page Experience · Design System Extensions
Tools
Figma · Microsoft Clarity · Google Speed Insights
Project Timeline
4 months
Year
2024–2025
Overview
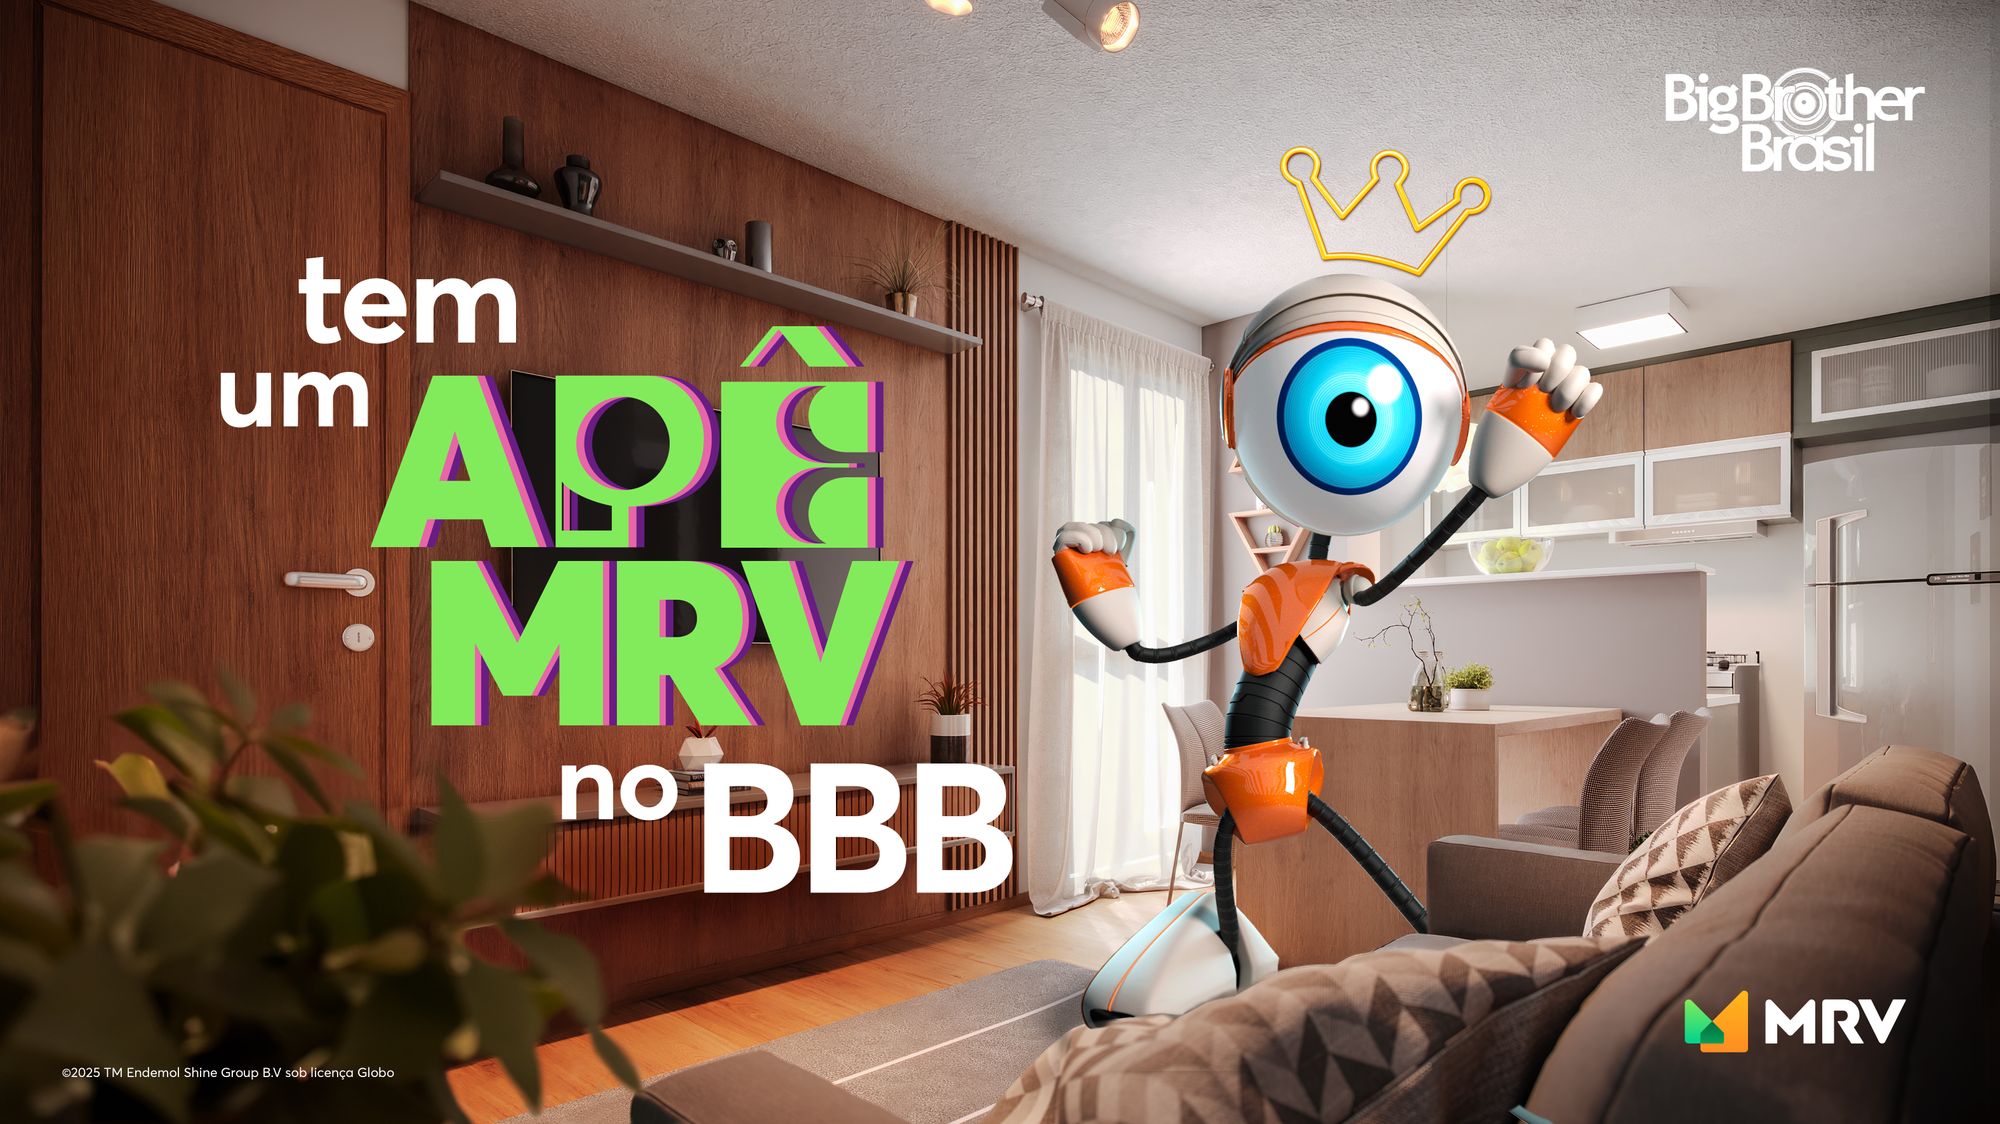
MRV, Brazil’s largest homebuilder and affordable real state and housing company, entered 2025 as one of the official sponsors of Big Brother Brasil 25 (BBB25), the most-watched reality show in Latin America.
With millions of viewers tuning in weekly, the company faced a critical challenge: ensuring digital experiences could match the scale and visibility of the TV campaign.
The sponsorship created a unique opportunity — every television insertion could generate a surge of visitors looking to learn about MRV’s products, simulate financing options, or interact with the AI-powered assistant.
The challenge wasn’t simply building a landing page. It was creating a conversion-focused experience capable of supporting one of the largest marketing initiatives in the company’s history under extreme traffic conditions.
Television campaigns generate awareness, but awareness alone does not create business value. MRV needed a digital destination capable of transforming curiosity into measurable engagement. The landing page would serve as the bridge between mass-media exposure and meaningful customer action — and it had to perform flawlessly during live broadcast peaks reaching 12x normal volume.
Design Process
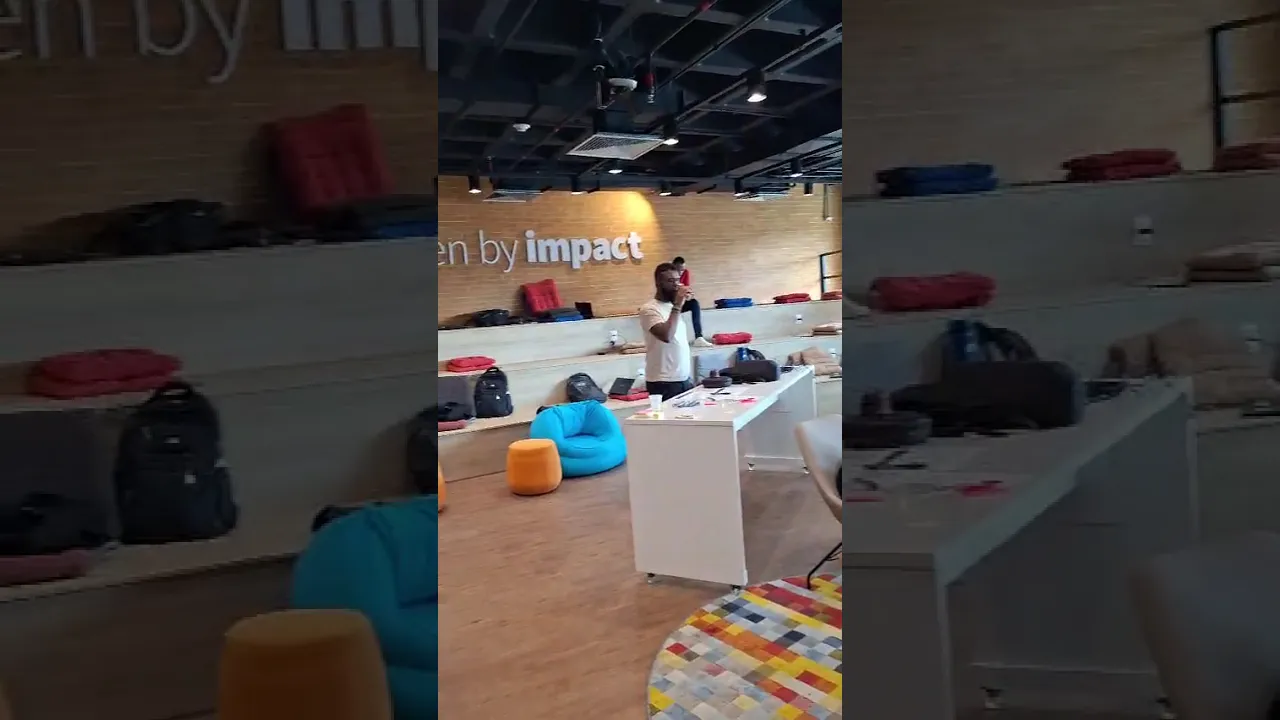
The project began with an in-person workshop at MRV’s regional headquarters — our team traveled more than 600km to facilitate face-to-face collaboration and accelerate early decision-making.
We structured the engagement using Design Thinking principles, combining discovery, ideation, and validation within a highly compressed timeline. Low-fidelity concepts were evolved rapidly into responsive high-fidelity prototypes for desktop and mobile.


After creating the first paper prototypes and wireframes, we conducted a moderated usability session with an MRV employee who had no prior knowledge of the project. Due to the confidential nature of the initiative, testing with external users was not possible.
I facilitated the session from a separate room, asking the participant to navigate the prototype, scroll through each section, and think out loud about what they understood and how they interpreted the experience. Meanwhile, the executive team observed the session from another room.
This allowed us to identify whether the concepts, content, and interactions felt intuitive and connected with real-world expectations before moving into high-fidelity design.
Facilitation Outcomes
After three days of workshops, we came away with a clear strategy, a low-fidelity prototype, a roadmap for the following weeks, and, most importantly, a strong sense of trust and collaboration within the team.
Below, you can see how the prototype evolved—from early Post-it ideation and Figma wireframes to the first application of the brand’s visual elements.

Artefacts
Responsive high-fidelity prototypes for desktop and mobile. AI assistant integration for real-time housing queries. Financing simulator optimized for mobile. Performance-hardened page architecture designed to sustain extreme traffic spikes without degradation.


Analytics Results
After the first deployment, I used Google PageSpeed Insights and Microsoft Clarity to evaluate the website’s performance across both mobile and desktop. The insights helped us identify usability and performance opportunities, providing a clear direction for the next round of iterations and improvements.


Outcomes & Results
• More than 120,000 conversions through the AI assistant and housing simulator.
• 4,153% increase in online searches for MRV.
• Approximately 1.2 million visits generated during individual campaign insertions.
• Traffic peaks reaching 12x normal volume during live broadcasts.
• Zero downtime during the campaign period.
• More than 14.9 million television viewers reached.
Lessons Learned
The most important design challenge wasn’t the interface — it was stakeholder alignment and clarity of purpose. Aligning on a single conversion goal before designing anything else was what made the experience performant and coherent under pressure.